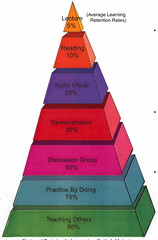
Learning Retention Rates
Originally uploaded by Eric Rice.
Looks like we need more opportunities to help others learn to enhance our own learning retention rates.
About Shawn Callahan
Shawn, author of Putting Stories to Work, is one of the world's leading business storytelling consultants. He helps executive teams find and tell the story of their strategy. When he is not working on strategy communication, Shawn is helping leaders find and tell business stories to engage, to influence and to inspire. Shawn works with Global 1000 companies including Shell, IBM, SAP, Bayer, Microsoft & Danone. Connect with Shawn on:
Comments
Comments are closed.
Any idea if this is based on sound science? I can’t find any research that directly supports these figures.
I’m very skeptical that this diagram is based on actual research. The source for this has been investigated at http://www.work-learning.com/chigraph.htm
I have this matrix a lot in train the trainer training, but think it is only applicable really for retention of information in terms of reproducing facts. I don’t think it applies to learning in general – there rather than the medium it’s important whether it touches upon your own question I think
Good question Harold and after some searching it seems that this diagram is a hoax of sorts. Here is an article which describes how this diagram evolved: http://www.work-learning.com/chigraph.htm
A hoax? It’s based on John Dewey, Albert Bandura and countless other education theorists. Certainly we can all agree the CHART is a hoax, but the paragidm behind it can easily be backed by theory from the 1900’s to today.