Bridges and Hubs in Social Networks
When it comes to Social Network Analysis (SNA) a common practice is to use centrality measures such as Betweenness (Bridgeness), Closeness and Degree. For instance, we often represent “Hubness” (in-degree) by colour scale, and “Bridgeness” (betweenness) by size. Resulting in:
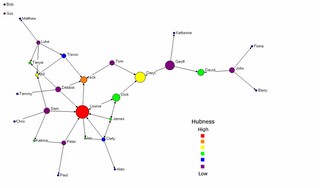
Hubness as it suggests gives an indication of who are the hubs in the network. Betweenness (or bridgeness) gives an indication to the people who are acting as ‘bridges’ across various networks. Centrality measures such as these give us a way of making sense of the ‘data’.
As Bruce Hoppe has mentioned there are subtleties to these centrality measures. One subtlety which I have dug around for an answer on is: how sensitive are measures like bridgeness and hubness to missing data?
Why bother you ask? If you are using a survey tool then you might be familiar with the phrase ‘survey response rate’. And maybe how poor response rates can often be.
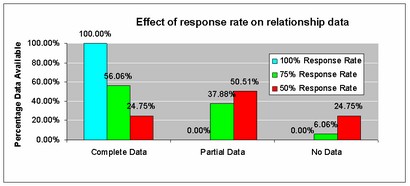
As this figure illustrates, even with a survey response rate of 75% there is only 56% complete relationship data available for use with the centrality measure of your choice. So, comparing between Hubness and Bridgeness, which is most robust to missing data? Turns out it’s Hubness. Interestingly, maybe even ironically, Bridgeness is sensitive to missing data. [See Costenbader and Valente 2003 for the details]
About Andrew Rixon
Twitter •
Comments
Comments are closed.
The Good Gnoos
For those who haven’t been checking out the Gnoos beta site, here it is.I like the interface, nice and clean, not too much stuff on it (that’s a hint Technorati).The only thing I don’t like, is the way it highlights